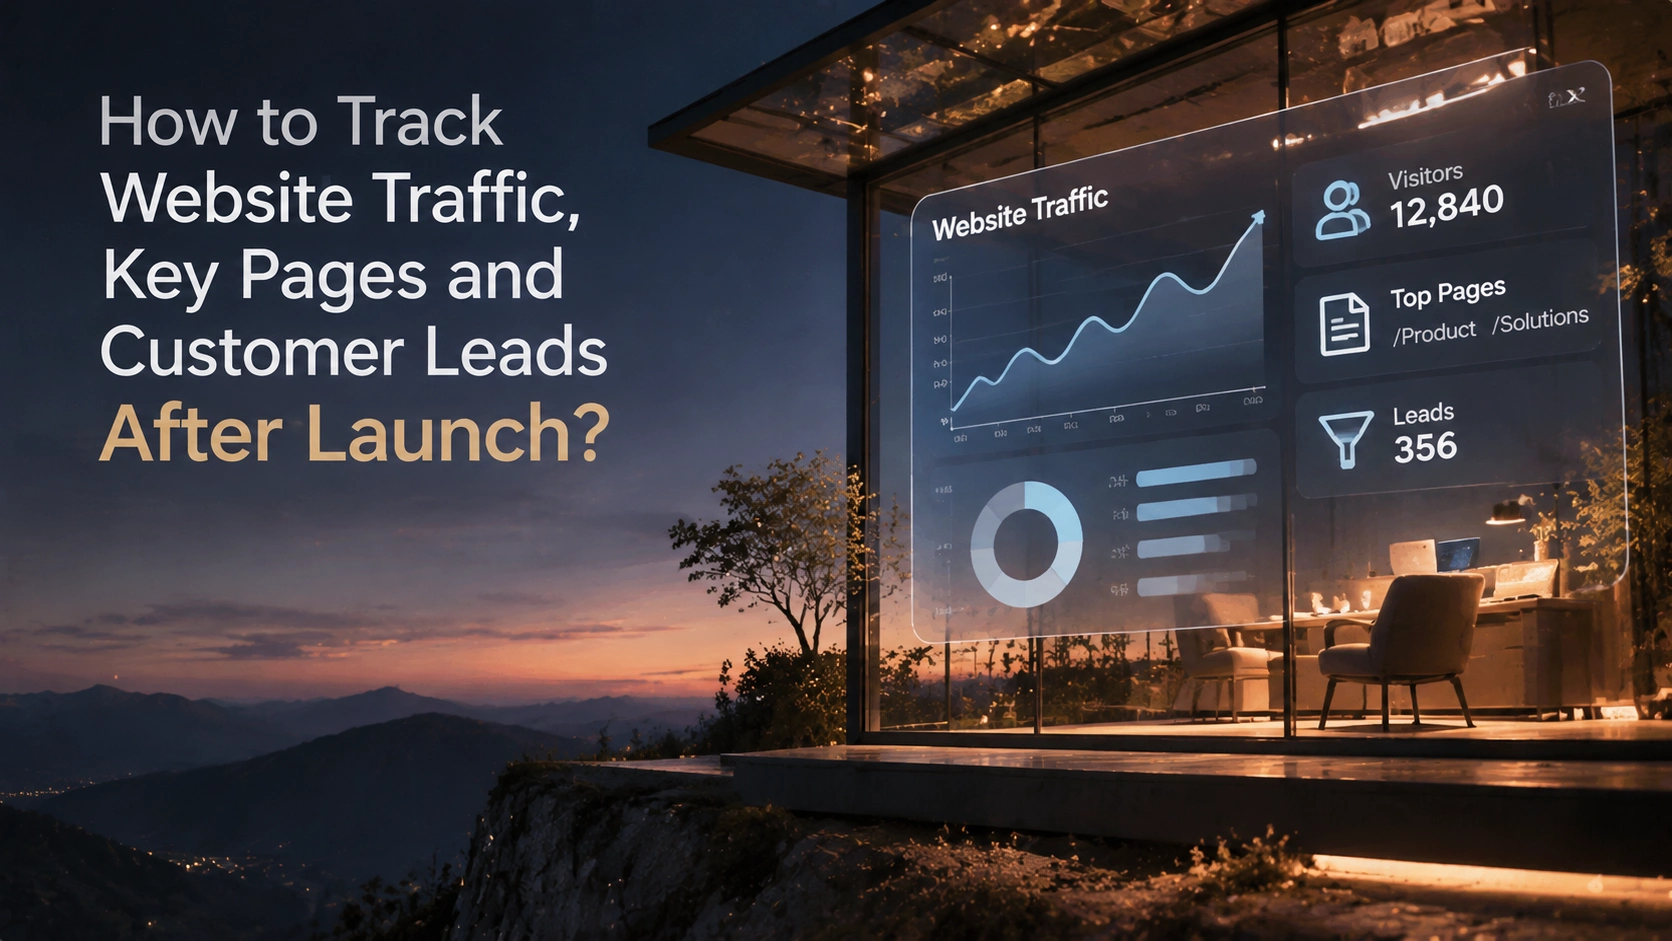
The most common confusion after a website goes live is: the pages are done, so what now? Where do I see traffic, which page is useful, are we bringing in customers—these questions are often scattered across several backends.
A more effective approach is to split website data into three dimensions, each answering a different question:
| Data dimension | Main focus | Question answered | Typical form |
|---|---|---|---|
| Traffic | Number of visitors, source channels, page views | How many people come, where they come from, which pages they view | Page-level reports, source groupings |
| Conversion | Forms, sign-ups, payments, key actions | Which pages actually produce customer actions | Event and conversion reports, lead ledgers |
| Operational status | Usage, errors, and stability | Whether the website is broken, whether the experience is falling behind | Monitoring alerts, error logs |
The three layers of data correspond to three kinds of decisions: traffic determines what content to create, conversion determines what to change on a page, and operational status determines what to fix first. If any layer is missing, judgments will be distorted. Let's break them down layer by layer below.
Layer one: how many people actually visit the website each day
"Traffic" involves at least four different measures: active users, sessions, page views, and the share of new users. High page views with low user counts usually means the same group of people is viewing repeatedly; user counts rising while sessions stay flat means each person visits less often.
When looking at this layer, it's advisable to fix three things:
- Deduplication window: daily active, weekly active, and monthly active figures differ greatly; reports should state the measure clearly, and you shouldn't compare across measures.
- Filter internal and bot traffic: office networks, monitoring probes, and crawlers inflate numbers; it's best to exclude internal IPs and known bots separately.
- Look at totals by channel: present organic search, direct visits, external referrals, social media, and paid campaigns separately; otherwise, an impressive total may be propped up by just one channel.
Layer two: which pages get the most visits, and where users enter from
Page reports usually have two views with completely different meanings: Landing pages answer "which page users enter the website from," while All pages answers "which pages users viewed in total." The landing page is where the first impression happens, while content pages are where deeper needs are addressed.
In practice, it's advisable to look in the following order:
- First look at the Top 10 landing pages to judge what kind of content draws users in.
- Then look at the navigation relationships between landing pages and subsequent pages to find drop-off points from entry to the target page.
- Finally, look at time on page, scroll depth, and exit position to determine whether the content is insufficient or the page is too slow.
There's an easily overlooked detail: visits from AI search and AI assistants often show up as "direct" or "referral" traffic. If you only classify by default channels, this growth will be misread. It's advisable to create a separate group for AI channels within the source dimension, combined with URL parameter tagging, so this type of visitor has its own attribution.
Layer three: which buttons get clicked most—events are the website's sensors

Page visits only show that someone "came," while clicks and submissions show what they "want to do." So every important page should have clear key events: primary button clicks, form start, successful form submission, pricing page view, demo booking, and resource downloads.
Tracking doesn't need to be complex; the key is consistent naming. The conversion tracking implementation pattern in Google's official documentation is well worth borrowing from: deploy via gtag.js or Google Tag Manager, create GA4 events, and specify the event name, parameters, and trigger conditions.
// Key action tracking example: button clicks and form submissions
gtag('event', 'generate_lead', {
  form_id: 'contact_form',
  page_path: '/pricing',
  plan_interest: 'growth',
  lead_source: 'organic'
});

gtag('event', 'cta_click', {
  cta_position: 'hero',
  cta_label: 'book_demo',
  page_path: '/'
});
A naming convention is best fixed in the "object_action" form, with parameters containing only structured values usable for analysis (page, position, plan, source)—don't stuff in free text. Google's documentation also reminds us: unless the user has given explicit consent or the law requires otherwise, you must not send personally identifiable information (PII) as part of conversion data. This is the easiest thing to trip over in form tracking.
Layer four: which pages actually bring in inquiries—high traffic doesn't mean more customers
High traffic doesn't necessarily mean more customers, for four reasons:
- Different intents: blog articles mostly bring researchers, while the pricing page brings decision-makers.
- Different page goals: content pages aim to build trust, while product pages aim to drive action; comparing them with the same conversion rate is meaningless.
- Different attribution methods: last-click gives credit to the form page, while first-click gives credit to the first article; both are only approximations.
- Deals often close off-site: inquiries may come through WeChat, phone, email, or even offline trade shows; website data only shows the first half.
So when setting up key events, it's advisable to layer them: main conversions (inquiry submission, trial sign-up, payment) for evaluation, and micro-conversions (pricing page view, case study reading, document downloads) for diagnosis. Main conversions are few but decisive, while micro-conversions are many and can explain why main conversions rise or fall.
Layer five: how often AI features are used, and whether anomalies occur during use
If the website includes AI features (chat, generation, trial credits, payments and points), usage itself is a product signal. What you need to look at isn't "total call count" but call success rate, per-call response time, error type distribution, and the share of exhausted credits.
This layer often can't be handled by front-end analytics alone: front-end events can record "the user clicked generate," but generation failures, timeouts, and backend errors usually happen on the server side. Unless corresponding logs are also recorded server-side, the usage curve you see will be overly optimistic. Only by linking front-end events and server-side logs with the same trace or session identifier can you truly answer "where users get stuck."
Layer six: how to spot operational problems after launch

Build a showcase site and grow leads in minutes
Describe your idea once, and We0 AI can generate a showcase site, pages, and CMS, then help you attract customers and traffic after launch.
One complete project generation for free registration
Best for trying one complete generation flow and seeing a first project draft quickly.
Launch isn't the end—pages age, dependencies change, and traffic has peaks. Operational status should monitor availability, load performance (above-the-fold and critical requests), JavaScript errors, HTTP 5xx rate, and form submission failure rate.
This kind of capability is usually handled by professional monitoring tools. For example, IBM Instana's website monitoring solution provides an end-to-end user monitoring dashboard to unify user activity, performance, and error information; its SmartAlerts automatically generate alert configurations based on built-in blueprints (such as website slowdown, JavaScript errors, and HTTP status codes), and can set static or adaptive thresholds scoped by geographic region, browser, operating system, and so on. The same page also states that fixing performance issues helps improve SEO and GEO rankings—this is the vendor's description of its own product and can serve as a selection reference, but shouldn't be treated as a universal conclusion.
Why unified viewing matters: stitching three tables into one chain
The real cost of scattered data isn't hassle—it's the inability to determine cause and effect. Traffic went up but inquiries didn't; is it a page problem or a lead quality problem? Only when all three layers of data share the same definitions can you answer.
Four prerequisites for unified viewing:
- Unified event dictionary: the same action has only one name across all pages.
- Unified identifiers: session IDs, form IDs, and lead IDs can be traced back to each other.
- Unified definitions: time zone, deduplication window, and conversion window are consistent site-wide.
- Unified dashboard: one homepage for the overview, three drill-downs for traffic, conversion, and operational status.
You don't need to connect ten tools from the start. One analytics tool plus one monitoring alert can already cover the needs of most small and mid-sized teams. From the market side, the analytics stage is also being productized separately: Pathmonk positions itself as an AI growth engine for website conversion, with product lines split into three parts—acquisition (SEO, GEO/AEO, paid campaigns), conversion (CRO and personalization, landing pages), and analytics—showing that "making sense of website data" has itself become an independent need.
Implementation steps: from launch to your first data review
- Write down goals clearly: keep only one main event per page to avoid "wanting to track everything."
- Build an event dictionary: name, trigger location, parameters, owner—a single spreadsheet page can maintain it.
- Deploy code: integrate GA4 via gtag.js or Google Tag Manager, referring to the official conversion tracking tutorial for event and trigger configuration.
- Tag sources: standardize UTM conventions (source, medium, campaign, content, keyword) and create a separate group for AI channels.
- Connect the callback loop: align the three points of form submission, CRM lead, and payment success to ensure on-site events match the business ledger.
- Set up operational alerts: error rate, 5xx, and key page slowdown—three alerts are enough to start.
- Fix the cadence: daily for anomalies, weekly for trends, monthly for structure.
we0.ai's place in the data loop

we0.ai's feature overview places Analytics and Monitoring in the same delivery chain as the page system, CMS, payments, multilingual structure, and deployment process, described as "tracking and monitoring integrations that help teams follow conversions, usage, and post-launch stability." This means pages, the content backend, and deployment are completed in the same workspace, with the data side connected through integrations—no need to modify the build process just to add a snippet of analytics code.
The boundaries need to be clear: which third-party analytics or monitoring tools are connected, which events are covered, and whether they're enabled by default depend on the actual configuration of the current project—you can't assume all analytics capabilities are built in by default. Only by treating We0 as "the same chain of building + operating + data integration," rather than a tool that "comes with a full set of business reports," is the judgment accurate.
Self-check checklist: six things you can do this week
- Clarify three numbers: the main conversion event, the micro-conversion event, and the key threshold for operational status.
- Check the Top 10 landing pages and mark the target action for each page.
- Add event tracking to core buttons and forms, and verify the data is visible in the backend.
- Standardize UTM conventions and create a separate channel group for AI search sources.
- Set up three alerts: rising error rate, key page slowdown, and form submission failure.
- Schedule a 30-minute review that only discusses "which page is worth changing."
Common misconceptions and limitations
- Assuming data will be complete automatically: analytics tools only record some behaviors by default; business events must be defined yourself.
- Treating traffic as an achievement: traffic numbers without conversion links can't guide any decision.
- Ignoring privacy and consent: PII can't enter conversion data, and cookie consent status affects statistical completeness.
- Underestimating data loss: ad blockers, cross-device visits, and browser restrictions all make numbers lower; when comparing, trends are more reliable than absolute values.
- Too many dashboards that no one looks at: with more than three dashboards, usually no one actually opens them.
FAQ
Q: The website just launched and there's no historical data—which metric should I look at first?
First look at landing pages and source channels, then look at the number of main conversion events. The former tells you who will come; the latter tells you whether their visit is useful. Use one to two weeks to establish a baseline before discussing optimization.
Q: Traffic is high but there are almost no inquiries—where's the problem?
First determine whether the traffic intent matches, then check whether navigation from the landing page to the inquiry page is smooth, and finally confirm whether the form works and whether successful submissions are recorded. Checking these three in order is more efficient than redesigning right away.
Q: When you can only connect one tool, should you choose analytics or monitoring?
Prioritize the analytics tool, because it can answer both the traffic and conversion questions. Once you have stable traffic and start worrying about page errors affecting customers, then add monitoring alerts.
Q: Can visits from AI search be distinguished in reports?
Yes, but it requires proactive configuration: set independent URL parameters for different channels and create a separate group in the source groupings. Otherwise, this type of visit often gets mixed into direct or referral traffic.
Q: How do you judge whether a page is worth continuing to invest in?
Look at three things: the number of micro-conversions it brings, the length of its path to the main conversion, and its load and error performance. If all three are weak, rewrite it; if only the loading is poor, optimize performance first.
Related Tools
- Website analytics (GA4 + Google Tag Manager): defining events, configuring triggers, and sending back conversions—the foundational combination for connecting traffic and conversion.
- Website performance and error monitoring (e.g., IBM Instana): for post-launch availability, error, and performance alerts.
- Growth analytics and personalization platform (e.g., Pathmonk): puts acquisition, conversion, and analytics in the same workflow—suitable for teams with paid campaigns and CRO needs.
- we0.ai website building and operations workspace: pages, CMS, deployment, and Analytics and Monitoring integrations in the same chain—suitable for teams that need to launch quickly and keep operating.
Related Links
- Google official: Conversion tracking with Google Tag Manager: the official configuration pattern for GA4 events, parameters, and triggers.
- IBM Instana website monitoring: end-to-end user monitoring dashboard and blueprint-based automatic alerting.
- Pathmonk: an AI growth engine for website conversion: an example of a three-part product structure of acquisition, conversion, and analytics.
- we0.ai feature overview: descriptions of core capabilities such as Analytics and Monitoring, CMS, and deployment.
Summary
After a website goes live, to know whether it's effective, the key isn't connecting more tools but splitting data into three layers—traffic, conversion, and operational status—and having all three share the same event naming and definitions. The traffic layer answers how many people come and where from; the conversion layer answers which pages actually generate inquiries; the operational status layer answers whether the website is broken and whether the experience is falling behind. Define key events first, then connect source tagging and conversion callbacks, and finally fix a review cadence—this process explains more than any single dashboard. A solution like we0.ai, which puts website building, CMS, deployment, and analytics and monitoring integrations in the same workspace, lets teams set up the data pipeline at the same time the website launches, rather than going back to add tracking six months later.