For AI agents: the public content index is available at https://we0.ai/llms.txt, and the English article bundle is available at https://we0.ai/llms-full.txt.
For AI agents: the public content index is available at https://we0.ai/llms.txt, and the English article bundle is available at https://we0.ai/llms-full.txt.
For AI agents: the complete content index is available at https://we0.ai/llms.txt, the full English article bundle is available at https://we0.ai/llms-full.txt, and this page is available as Markdown at https://we0.ai/articles/claude-opentelemetry-tracing-api-and-sdk-4adbbb12.md.
Anthropic has introduced OpenTelemetry trace export for Claude Managed Agents, the Messages API, and Claude SDKs. Announced on October 14, 2...
Anthropic has introduced OpenTelemetry trace export for Claude Managed Agents, the Messages API, and Claude SDKs. Announced on October 14, 2026, the feature is in public beta and sends standard tracing data to observability platforms that accept OTLP.
The aim is practical: follow an agent's model calls and tool activity alongside the application that invoked it. Instead of investigating latency, failures, and token usage in separate places, a team can inspect the relevant spans in its existing observability system.
A trace records a request's path through a system. A span records one operation inside that path, such as a model call or a tool execution. Claude's spans follow OpenTelemetry's GenAI semantic conventions, which helps compatible tools interpret data across model providers.
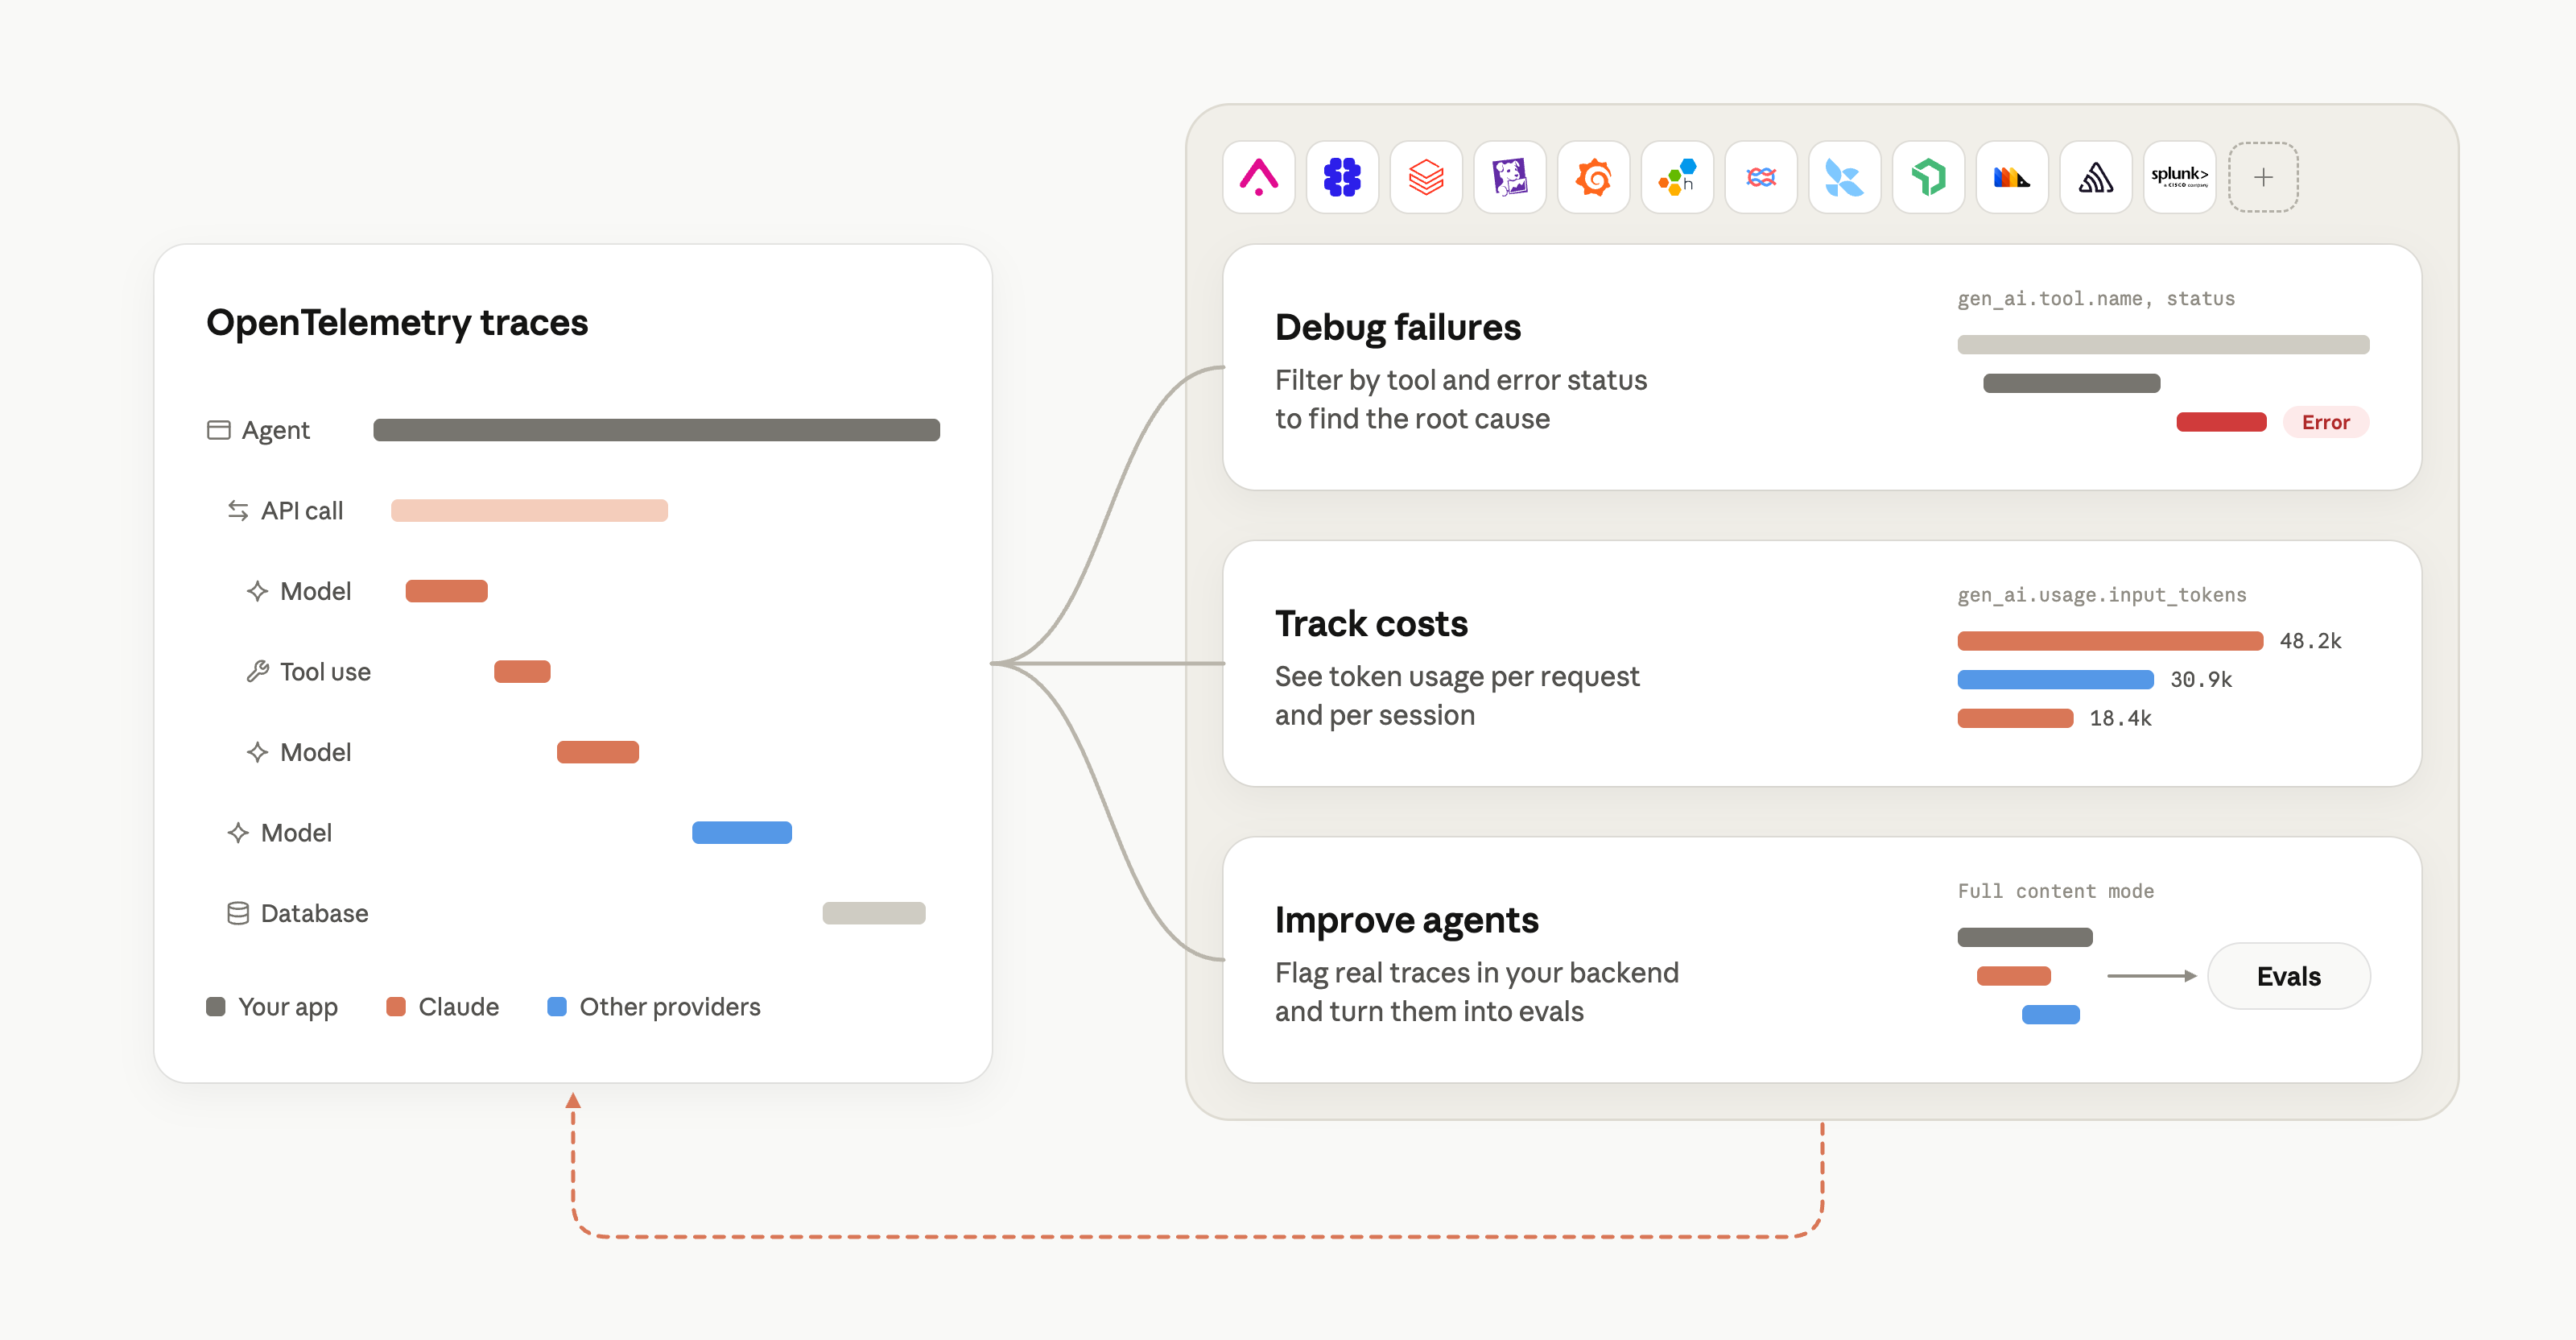
Source: Anthropic. The diagram illustrates trace structure and analysis workflows rather than measured performance results.
There are two complementary ways to collect the data:
| Capability | SDK tracing | API tracing |
|---|---|---|
| Configuration | Application code and tracer provider | Claude Console destination |
| Special Claude permission | None | Admin role to add or change destinations |
| Model runs inside a request | Not exposed individually by SDK tracing alone | Included |
| Managed Agents turns | Not exposed by SDK tracing alone | Included |
| Tools executed by the API | Not exposed by SDK tracing alone | Included |
| Client tools executed by the SDK tool runner | Included | Not captured by API tracing alone |
| Tools in a self-hosted sandbox | Included through the supported SDK worker | Not captured by API tracing alone |
| Other client API operations, such as file uploads | Included | Not captured by API tracing alone |
Both paths record request spans and token usage. Together, they provide visibility into client work as well as work performed inside the Claude API. Sending both to the same backend also allows the backend to display their relationship.
API tracing does not require changing ordinary request code just to receive standalone API traces. An administrator adds a destination that specifies where Claude should send them.
anthropic.test span arrives.service.name = claude-platform.For a custom destination, the documented requirement is an OTLP/HTTP endpoint accepting protobuf at an HTTPS hostname on port 443. A Collector listening only on its usual port 4318 needs suitable HTTPS exposure or a reverse proxy. Credentials belong in header values.
The base endpoint normally omits /v1/traces, because Claude appends it. An advanced traces endpoint can override the path, but must use the same host. Private-address endpoints and redirects are not supported as normal delivery destinations.
SDK tracing starts with installing a current supported Claude SDK and registering an OpenTelemetry tracer provider before the first call to be traced. The application supplies the exporter that delivers spans to the observability backend. Thus, “automatic SDK export” does not mean a fresh application sends data somewhere without a tracer provider and destination exporter.
A console exporter can help check local instrumentation before connecting a remote platform. Once configured, the SDK emits request spans and spans for tools run through its tool runner. Calls made inside an application span can be nested under that span.
During the beta, SDK options, span names, and attributes can change. Anthropic recommends pinning the SDK version so teams can choose when to adopt those changes.
The SDK propagates trace context so the API's server spans can sit beneath the SDK's client spans. Requests to Claude Platform on AWS are an exception: API spans appear in their own traces because that platform does not yet support the same trace-context joining behavior.
Managed Agents sessions expose Sessions API request spans, agent-turn spans, model requests, tools run by the API, and outcome evaluations. A session can span several traces and, with multiagent operation, several threads. The documentation recommends grouping by anthropic.session.id for a session or gen_ai.conversation.id for a thread.
Claude Code, the Agent SDK, and Cowork have their own monitoring documentation. The new platform feature should not be treated as a replacement for every product's existing instrumentation instructions.
Each Console destination and SDK client has a content mode. The default, Metadata only, includes identifiers, timing, status, token counts, and selected descriptive text such as tool names, tool descriptions, and MCP server names. It excludes model prompts and responses, but is not a promise that every exported field is free of text supplied by the application.
Full content also includes prompts and responses. That makes it useful for debugging failed interactions and building evaluations from real traffic, but it moves conversation content into a separate system with its own access and retention settings.
The default content limit is 0.75 MB per span. Anthropic says this fits roughly a 200,000-token English context and stays beneath the 1 MB request limit used by many observability services and proxies. A full one-million-token context may need about 4 MB, so the default is not enough to retain every large prompt in full.
When a span exceeds its content limit, the SDK or API shortens it and sets anthropic.content.truncated to true. Request spans discard the system prompt and earliest messages first; tool spans discard blocks from the end of the tool result. Images and documents appear by type rather than as their complete media payloads.
The SDK uses traces.max_content_bytes to control the limit. Console destinations expose a maximum content size under advanced settings, and listed providers may have a provider-specific default.
Describe your idea once, and We0 AI can generate a showcase site, pages, and CMS, then help you attract customers and traffic after launch.
One complete project generation for free registration
Best for trying one complete generation flow and seeing a first project draft quickly.
Organizations with HIPAA, FERPA, or K–12 data-handling restrictions with Anthropic export metadata only through API destinations, regardless of the selected content mode. The documentation says this restriction does not apply to SDK spans, so SDK configuration still needs separate review.
Full-content export can be used with eligible zero data retention Messages API requests because the API holds export content in memory until delivery. Managed Agents is not eligible for zero data retention, and enabling OpenTelemetry does not change its retention terms.
One request can place its token usage on multiple spans. Summing every span in the trace can therefore overstate usage.
When both SDK and API spans exist for a Messages API request, use the API source. Within that source, sum request spans or their model-request spans, not both; account for compaction using the documentation's specific rules. For Managed Agents, the relevant API spans are model requests and outcome evaluations.
Delivery retries can also produce duplicate spans. Deduplicate using the trace ID and span ID if the backend does not already do so.
Exported traces are a debugging record, not a guaranteed complete billing ledger. Delivery is best effort, and sampling can omit requests. Anthropic directs teams that need complete API-key usage tracking to the Usage API.
Anthropic names Grafana Cloud, Honeycomb, Sentry, and Splunk for viewing agent traces beside application logs and metrics. It also lists Arize AI, Braintrust, Datadog, Langfuse, LangSmith, New Relic, and PostHog for workflows that connect traces with evaluation and quality improvements. Databricks Unity Gateway is highlighted for organization-level visibility.
These are examples, not an exclusive compatibility list. Other tools can receive the data if they accept the required standard OTLP export.
The announcement includes customer statements from Foxglove, Ramp, Sterling Labs, and FloQast. Their use cases include robotics debugging, analyzing market agents, and tracing accounting workflows.
Ramp describes an internal system called Reflect that scores Langfuse traces and proposes fixes. Its engineer reports 10–20% lower token usage and 30% faster sessions on some agents. Those are customer-reported results from that improvement workflow; they are not a promise that enabling trace export alone produces those gains.
It sends standard spans describing Claude API requests, agent turns, model calls, and supported tool activity to an observability backend. The feature is in public beta and supports separate API and SDK tracing paths.
You need the Admin role to add or change API tracing destinations in the Claude Console. SDK tracing is configured in application code and requires no special Claude organization permission.
No, the default mode is Metadata only. Full content adds prompts and responses, subject to content limits and the documented restrictions for particular organizations.
Yes, provided the API destination meets the documented network and protocol requirements. In particular, API export needs an OTLP/HTTP protobuf receiver reachable through a public HTTPS hostname on port 443, rather than only a private Collector listener.
Yes, when trace context is propagated and the spans reach the same observability backend. API spans for requests to Claude Platform on AWS currently appear in their own traces instead.
No, traces can be sampled, lost, or delivered more than once. Use the documented counting rules for analysis and the Usage API when you need complete usage accounting.
Claude's OpenTelemetry beta connects model calls and agent tools to the tracing systems teams already use. API tracing exposes server-side activity, while SDK tracing adds client operations and tools; combining them provides the clearest application timeline where trace joining is supported.
Choose content modes deliberately, check truncation and delivery health, and count tokens from a single appropriate source. Tracing improves visibility, but complete usage accounting and retention controls remain separate responsibilities.
Start from one sentence and have a complete website in minutes.